Economic news reports a small set of measurements: how fast an economy is growing, how quickly prices are rising, what it costs to borrow money and how many people have work. Once you know what each measure counts and why central banks react to it, most headlines become easy to follow. This guide explains each measure, shows how a change in one feeds into the others, and sets out how to judge whether a warning about recession is evidence or speculation.
TL;DR
- Four measures drive most economic headlines: GDP (output), inflation (prices), interest rates (the cost of money) and unemployment (jobs).
- Central banks raise rates to slow price rises and cut them to support growth, but the effect reaches households and firms gradually, not overnight.
- Check where a number comes from, compare it with earlier releases, and read the whole report rather than the headline.
- Recession warnings deserve attention when several independent indicators point the same way, not when one forecast makes a dramatic claim.
- Emadan publishes economic news in plain English, with background context and key takeaways, so you can follow each release without the jargon.
Table of Contents
- What economic news actually covers
- The four measures behind most headlines
- Why central banks move rates and what happens next
- How the numbers reach your household and your employer
- Manufacturing surveys and market moves
- How to judge whether economic news is reliable
- Recession warnings: evidence or speculation?
- Perspective
- Follow the economy with Emadan
- FAQ
- Sources
What economic news actually covers
Economic news is the reporting of official statistics and policy decisions that describe how well an economy is working. The statistics come from national statistics offices, central banks and international bodies. The decisions come from governments and central banks. A typical story pairs the two: a new figure is published, and a policymaker responds or is expected to.
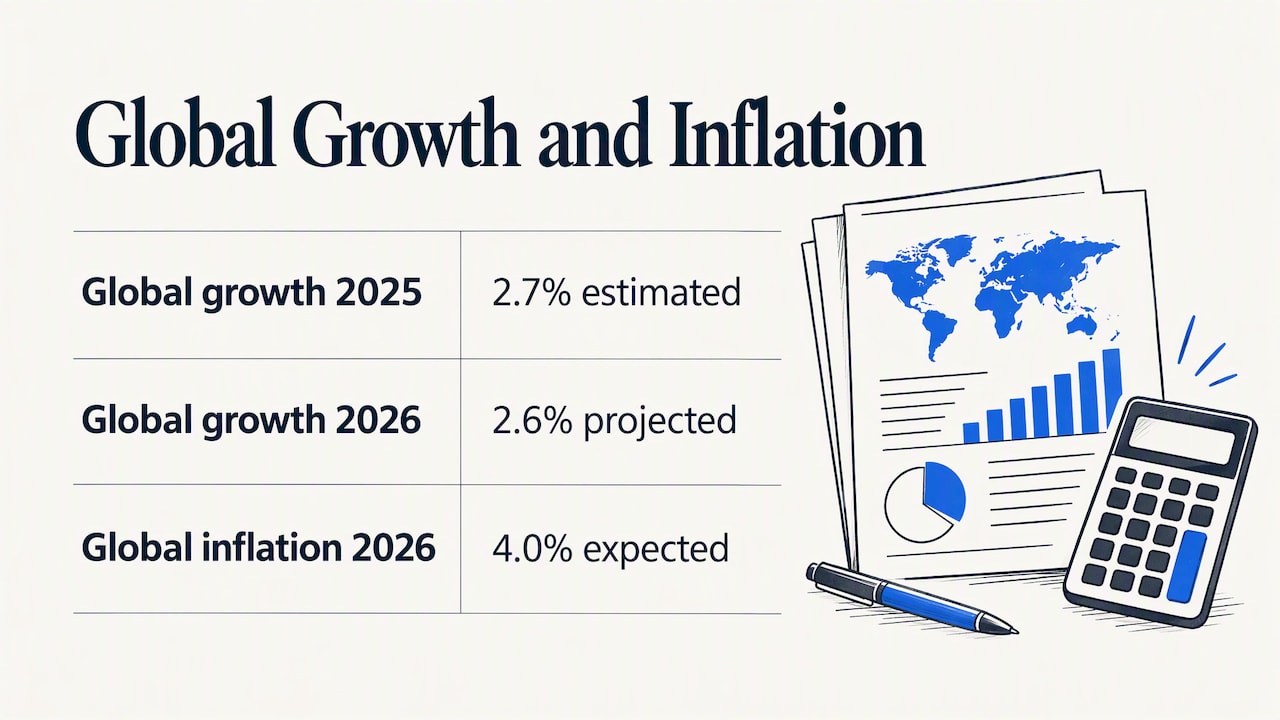
The global picture gives the headlines their backdrop. The World Bank estimated global growth at 2.7 percent in 2025 and projected a slowdown to 2.6 percent in 2026. Its later assessment said global headline inflation is expected to reach 4.0 percent in 2026, driven by higher energy prices and supply disruption linked to the conflict in the Middle East. The same January analysis suggests that AI-related activity could broaden, lift near-term growth and eventually strengthen labour productivity.
These are forecasts and estimates, which is the first thing to notice in any economic story. A reported figure is either a measurement of the past, an estimate of the present or a projection of the future. Each carries a different level of certainty, and a good report says which one it is.
The four measures behind most headlines
GDP: how much an economy produces
Gross domestic product is the monetary value of the final goods and services produced within a country in a given period, such as a quarter or a year. When a headline says the economy grew 0.4 percent in the third quarter, it means output was 0.4 percent higher than in the previous quarter, after adjusting for price changes in the figure usually quoted.
Two habits help here. First, check whether the figure compares with the previous quarter or with the same quarter a year earlier, because the two can differ widely. Second, remember that GDP is a total. It does not show how growth is shared between regions, age groups or income levels.
Inflation: how fast prices rise
Inflation is the rate of increase in prices over a given period, usually measured as the overall rise in prices or in the cost of living. A reading of 4 percent does not mean prices are 4 percent high. It means they are 4 percent higher than a year earlier. If inflation falls from 4 percent to 3 percent, prices are still rising, only more slowly.
You will often see a second figure called core inflation. It excludes government-set prices and more volatile ones such as food and energy to show the underlying, persistent trend, and policymakers watch it closely. When headline and core inflation move apart, the cause is usually an energy or food price swing.
For a worked example of how a single release is reported, our explainer on the current US inflation rate and the latest CPI figure sets out the number, the components behind it and what it means for households. Our report on Australia’s September CPI rising to 4.3% shows the same chain from price data to a central bank decision.
Interest rates: the price of money
An interest rate is the cost of borrowing money or the return earned on savings. Central banks set key policy rates to influence financing conditions across the economy. In the United Kingdom, the Bank of England sets Bank Rate, and the Government gives it a target: keeping inflation at 2%.
The Bank explains why the target is not zero. A 2% goal is low enough to keep price rises small but high enough to avoid deflation, because falling prices can lead firms to cut wages and staff. That explains why a central bank can worry about inflation being too low as well as too high.
Unemployment: how many people are out of work
The jobless rate is the share of people looking for work who cannot find it. It is a lagging indicator. According to the IMF, unemployment tends to trail changes in economic activity, because companies often cut hours or overtime before they resort to layoffs in a recession. A stable jobs figure therefore does not prove the economy is healthy, and a rising one often confirms a slowdown that began months earlier.
Why central banks move rates and what happens next
The most common economic headline asks whether a central bank will raise, hold or cut rates. The logic is consistent across countries.
The European Central Bank describes a transmission mechanism: changes in the central bank’s rate influence the lending and deposit rates offered in the market, which in turn affect the saving and investment decisions of households and businesses. Over time, this works through asset prices, borrowing costs and eventually overall demand and inflation. The word “eventually” matters. A rate decision today shapes prices over a period of quarters, not days.
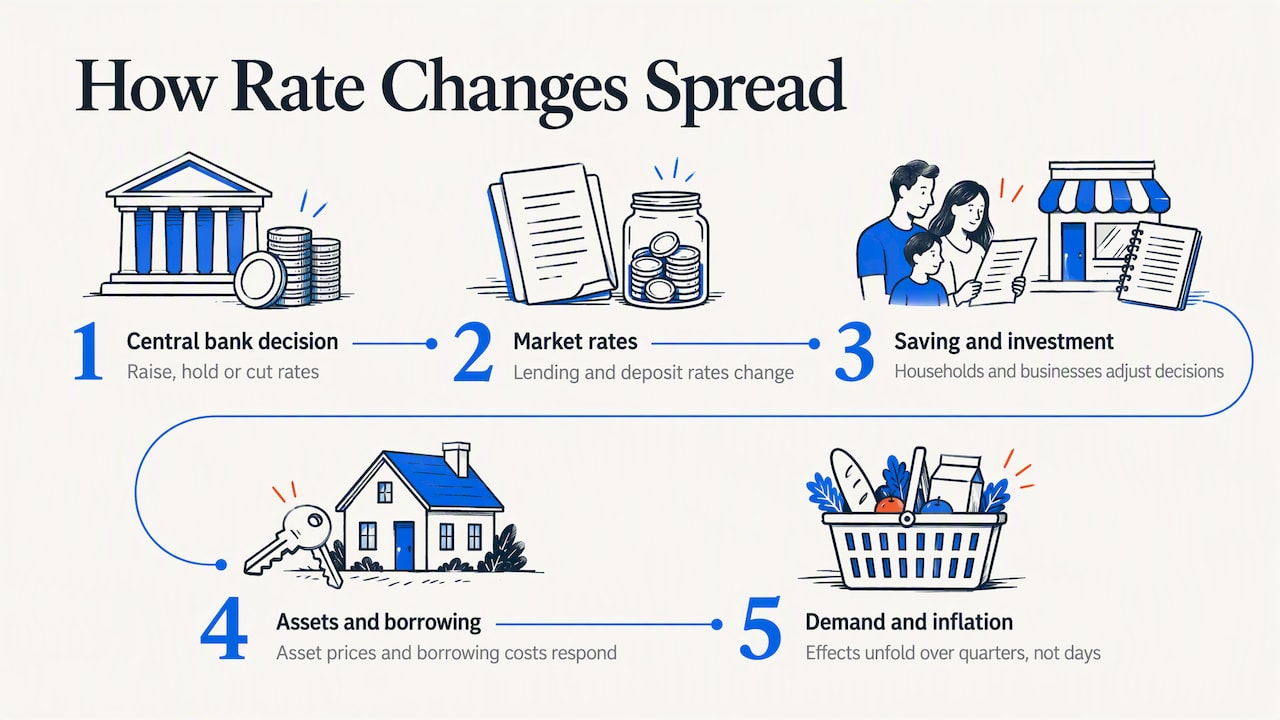
The direction follows from the aim. When rates are raised above a neutral level, growth is generally restrained and inflation can fall. The ECB also notes that tightening can cause a short-term dip in labour productivity, as firms produce less with existing staff before they potentially adjust their workforce. It adds that firm profits often absorb initial cost shocks, which can delay the effect of policy on consumer prices.
Expectations add a further layer. The IMF points out that expectations of future inflation can become self-fulfilling, because businesses and individuals build anticipated price rises into wage and contract negotiations. That is why central bankers choose their words so carefully, and why a statement can move markets as much as a decision.
Recent decisions show the pattern in practice. Our report on the ECB holding rates at 2.50% explains how markets read the signals about the next meeting, and our coverage of the Bank of Japan holding its rate at 1.25% shows how a central bank can combine a rate decision with other balance sheet measures.
How the numbers reach your household and your employer
A useful way to turn any statistic into a personal question is to ask who pays more and who earns more.
| Development | Typical effect on households | Typical effect on businesses |
|---|---|---|
| Higher interest rates | Higher cost of variable-rate borrowing; better returns on savings | Costlier loans, so investment and hiring may slow |
| Lower interest rates | Cheaper borrowing; lower returns on savings | Easier financing for expansion |
| Rising inflation | Everyday goods cost more; pay may lag prices | Higher input costs; pricing decisions get harder |
| Slowing growth | Fewer job openings, slower pay growth | Weaker demand for products and services |
| Rising unemployment | Lower household income and confidence | Less consumer spending |
These are general mechanisms drawn from the central bank and IMF explanations above, not forecasts for any one person. The size and speed of each effect depend on the country, the sector and individual circumstances.
The Federal Reserve Bank of Richmond recommends the supply and demand framework as the basic tool for understanding cause and effect in the news. It notes that economic events often affect both the supply and demand sides of a market, and that judging which side is hit harder helps predict price changes. An oil supply disruption raises fuel prices because supply falls. A surge in consumer spending raises prices in another way, because demand outruns supply. The headline looks similar, the cause differs, and so does the likely path of the policy response.
Manufacturing surveys and market moves
Beyond the headline four, you will meet surveys such as the purchasing managers’ index (PMI). A PMI asks firms whether activity, orders and employment are higher or lower than the month before. A reading above 50 signals expansion and below 50 signals contraction. Because it is published quickly, it is often an early read on the economy before official GDP arrives. Our report on China’s factory activity contracting as the October PMI fell to 49.3 shows how a sub-50 reading is reported and what the sub-indices add.
Stock market stories are a different category. Prices move on expectations, so a market fall tells you what investors fear or expect, not what the economy has already done. Our piece on Asian markets sliding ahead of a Bank of Japan decision is an example of a market story where the central bank decision is the cause to look for.
How to judge whether economic news is reliable
Not every number deserves the same trust. Four checks take a few minutes and remove most confusion.
- Find the source. Reporting guidance for journalists advises readers to identify where numbers come from, consider what indicators leave out and set different indicators against each other. A figure with a named statistics office or central bank behind it is stronger than an unattributed one.
- Compare with earlier data. Business journalism training suggests readers consult statistical and government websites, with their reports and announcements, and compare recent figures with earlier data to identify trends. One month is a data point. Several months are a trend.
- Read beyond the press release. The same guide encourages going to supplementary government reports for detail the headline omits. Revisions are common, so a first estimate may later change.
- Watch for tone. Research on economic coverage from Penn State’s News Literacy project notes that reporting can overemphasise doom-and-gloom scenarios at the expense of more hopeful long-term trends. A frightening headline is not evidence of a frightening outcome.
Indicators also act as a regular report card. As the same journalism guide explains, they help citizens assess how well government policies are working, which is why the same figure can be presented very differently by supporters and critics of a government.
Recession warnings: evidence or speculation?
Readers often ask whether a recession or collapse is coming. No single indicator answers that, but there are well-known tests and you can apply them yourself.
A Congressional Research Service review names three popular indicators: two quarters of negative real GDP growth, the Sahm rule and an inverted yield curve. The same review cautions that no rule of thumb matches every officially declared recession. It notes that the pandemic recession lasted two months, not even one quarter, so it would have escaped the two-quarter test.
A practical approach follows from this:
- Breadth. Is the weakness in output, jobs, surveys and spending together, or in one series only?
- Persistence. Has it lasted several releases, or is it one weak month that may be revised?
- Source. Does the warning come from a published model and data, or from a commentator’s opinion?
- Distance. A forecast of slower growth, such as the World Bank’s projection of 2.6 percent global growth in 2026, is not a forecast of contraction.
When one of these is missing, treat the warning as speculation to monitor, not a conclusion. When all four line up, the risk is real and worth following closely in official releases.
Perspective
Economic reporting fails readers most often when it assumes they already know the vocabulary. A story that mentions a “sub-index” or “core inflation” without a plain definition loses the very people the number affects.
Our approach is to keep the language plain and the evidence visible. Each story is designed to open with a quick answer, followed by key takeaways, the background that makes the figure meaningful and answers to the questions readers most often have. We write from verified reporting by reputable sources, we aim to avoid sensationalism, and we correct errors promptly.
We think this matters most with economic news, because the stakes are personal: mortgage costs, grocery bills, job prospects. Readers do not need less detail. They need the right detail in the right order, with the number, the cause and the consequence side by side. That is the standard we hold our own coverage to.
ISSB
Follow the economy with Emadan
Emadan covers business, politics, science, technology, sports and world events in plain English. Each article is built to give you a quick-answer summary, the key takeaways and the context behind the figure, so you can understand a release in minutes.
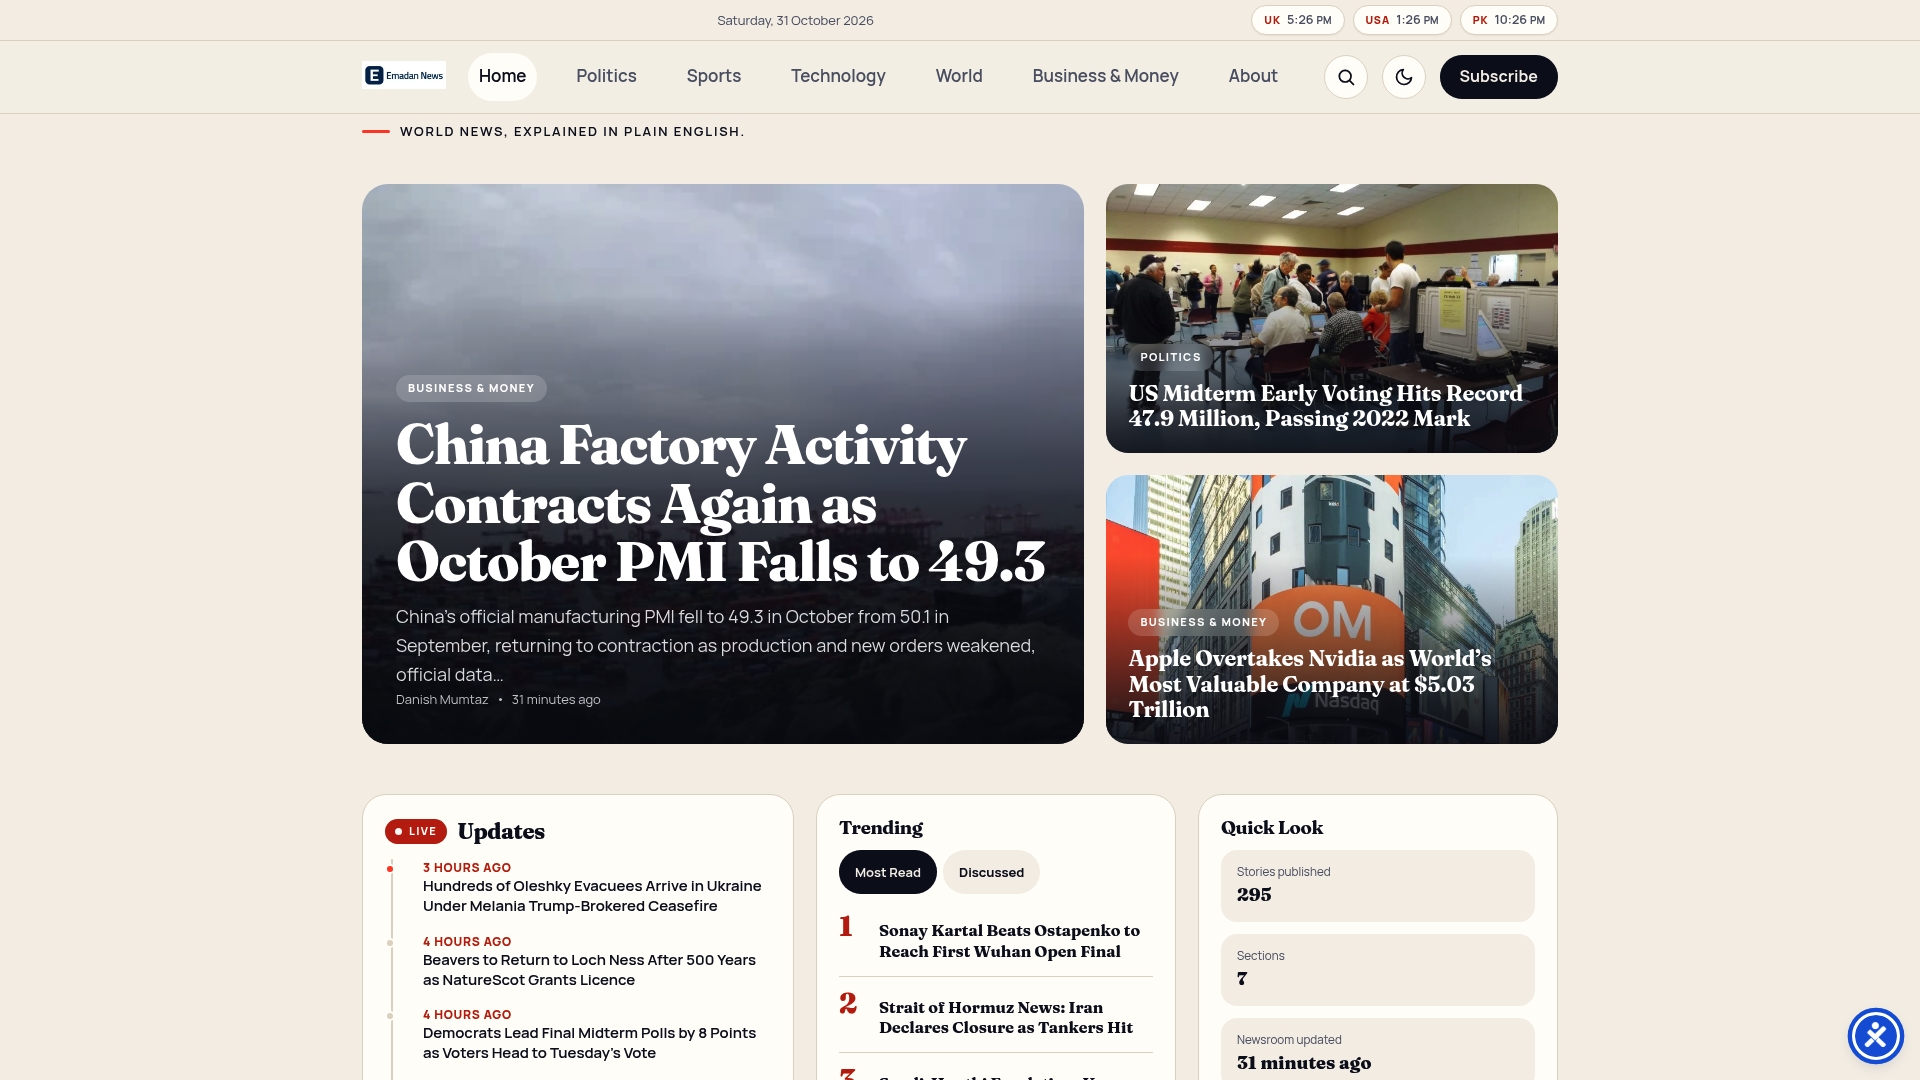
If you want to see how a new release is explained from start to finish, start with the Emadan news homepage, where the latest economic and market stories are collected. There is no subscription to pay for and no account to create.
FAQ
What is the best way to follow economic news if I am not an economist?
Learn the four core measures: GDP, inflation, interest rates and unemployment. Then read each story for three things: what was measured, how it compares with the previous release, and what the central bank or government may do next. A source that defines its terms in plain English makes this much easier.
Why does inflation matter if my pay is rising?
What counts is whether pay rises faster than prices. If inflation is 4 percent and your pay rises 3 percent, your spending power has fallen even though your salary went up. Inflation also feeds back into pay talks, because expected price rises are built into wage and contract negotiations.
Does a falling inflation rate mean prices are coming down?
No. Falling inflation means prices are still rising, just more slowly than before. Prices only fall when inflation turns negative, a condition called deflation. The Bank of England explains that falling prices can harm the economy by squeezing business income, wages and jobs.
Are two quarters of falling GDP always a recession?
It is a popular rule of thumb, not an official definition everywhere. The Congressional Research Service notes that not all recessions feature two consecutive quarters of negative growth. Economists look at jobs, income, spending and other indicators together before drawing a conclusion.
Why do central banks react to economic news so slowly?
Because interest rate changes take time to spread. The European Central Bank describes a transmission mechanism in which a rate change gradually affects lending, saving, asset prices and demand. Central banks therefore act on forecasts as well as on current data.
Sources
- World Bank, Global Economic Prospects, January 2026, Chapter 1
- World Bank, Global Economic Prospects, June 2026 press release
- IMF, Back to Basics: What Is Gross Domestic Product?
- IMF, Back to Basics: What Is Inflation?
- IMF, Finance & Development, June 2012: Tracking the Global Economy
- ECB Data Portal, What are interest rates?
- ECB, Transmission mechanism
- ECB, Monetary policy instruments and the strategy review
- ECB blog, What drives domestic inflation?
- Bank of England, Inflation and interest rates FAQs
- Richmond Fed, Understanding Economics in the News
- BusinessJournalism, Business Beats Basics: Economics chapter
- Reporting with Numbers, Using numbers and statistics in reporting
- Penn State News Literacy, What’s Missing From Economic News?
- Congressional Research Service, Defining Recession
Recommended
- Current US Inflation Rate: Latest CPI Figure and What It Means
- ECB Holds Rates at 2.50% as European Stocks Hit Seven-Week High and December Hike Moves Into View
- US Stocks Slide Friday as Amazon and Intel Earnings Deepen AI-Spending Sell-Off
- Nasdaq 100 Faces More Than $2 Trillion October Wipeout as AI-Spending Fears Deepen
Made with BabyLoveGrowth to grow your backlink profile